Pittsburgh · Texas
InsideFive years of New York grid prices, forecast as a distribution. A1

The Daily Spread

Caleb Vinson, Editor

BenchmarksWhere the naive baseline won, and where it didn't. B2
Vol. I · No. 1 Markets · Models · Code
PYTHON ▲ 14 R ▲ 2 C ▲ 2 VBA ▲ 1 PUBLIC REPOS ▲ 19

Power Markets

Five Years of New York Grid Data, One Probabilistic Price Forecast

A market-data warehouse feeds LEAR, LightGBM and structural congestion models, all scored under time-block cross-validation.
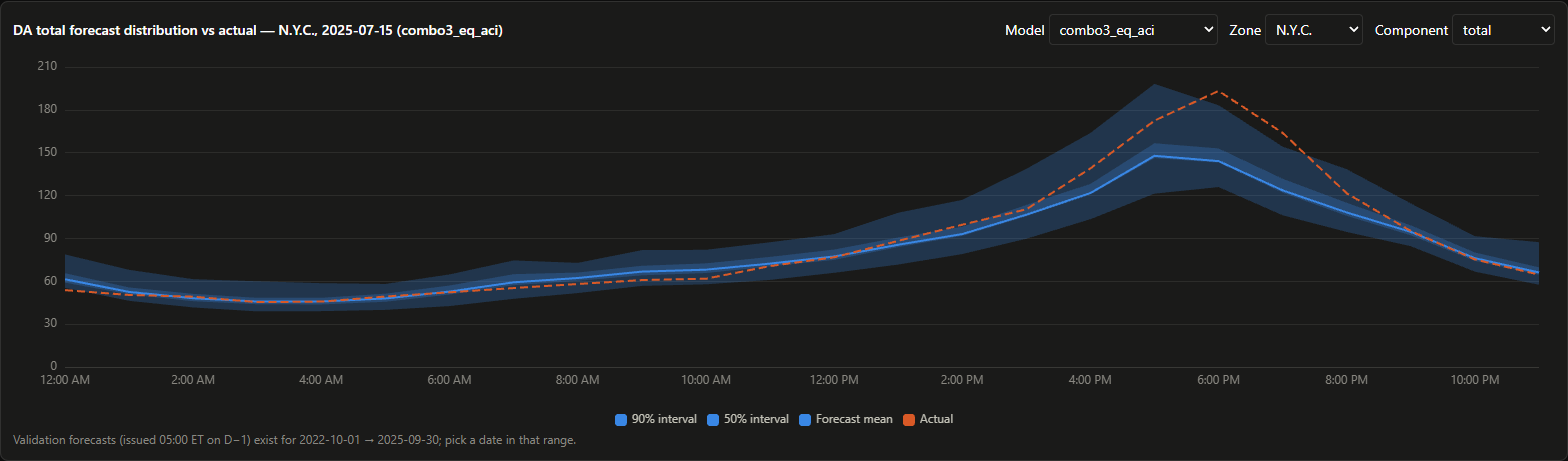
Day-ahead forecast distribution for New York City on July 15, 2025, showing 50% and 90% intervals around the forecast mean, with the actual price peaking near $190 around 6 p.m.
Day-ahead forecast for N.Y.C. on July 15, 2025. The shaded bands are the 50% and 90% intervals; the dashed line is what the price actually did.nyiso-grid dashboard

Electricity prices in New York move with load, weather and transmission congestion, and those forces change from one hour to the next. The nyiso-grid project collects five years of NYISO market data into a DuckDB warehouse. On top of it sit locational marginal price forecasts that give a full distribution instead of a single point estimate.

The models are a LEAR regression, LightGBM, and a structural congestion model, each tested on time-block cross-validation so that no future data leaks into training.

“A forecast that only gives one number can't tell you how wrong it might be.”

Overfitting diagnostics are part of the pipeline, not an afterthought. A dashboard is included. Joint DA/RT scenarios now feed TCC and DART pricers; neither beats its baseline yet, so the DART pricer is being tested forward on live data.

Map of the constraints, A2 →

Python · DuckDB · LightGBM

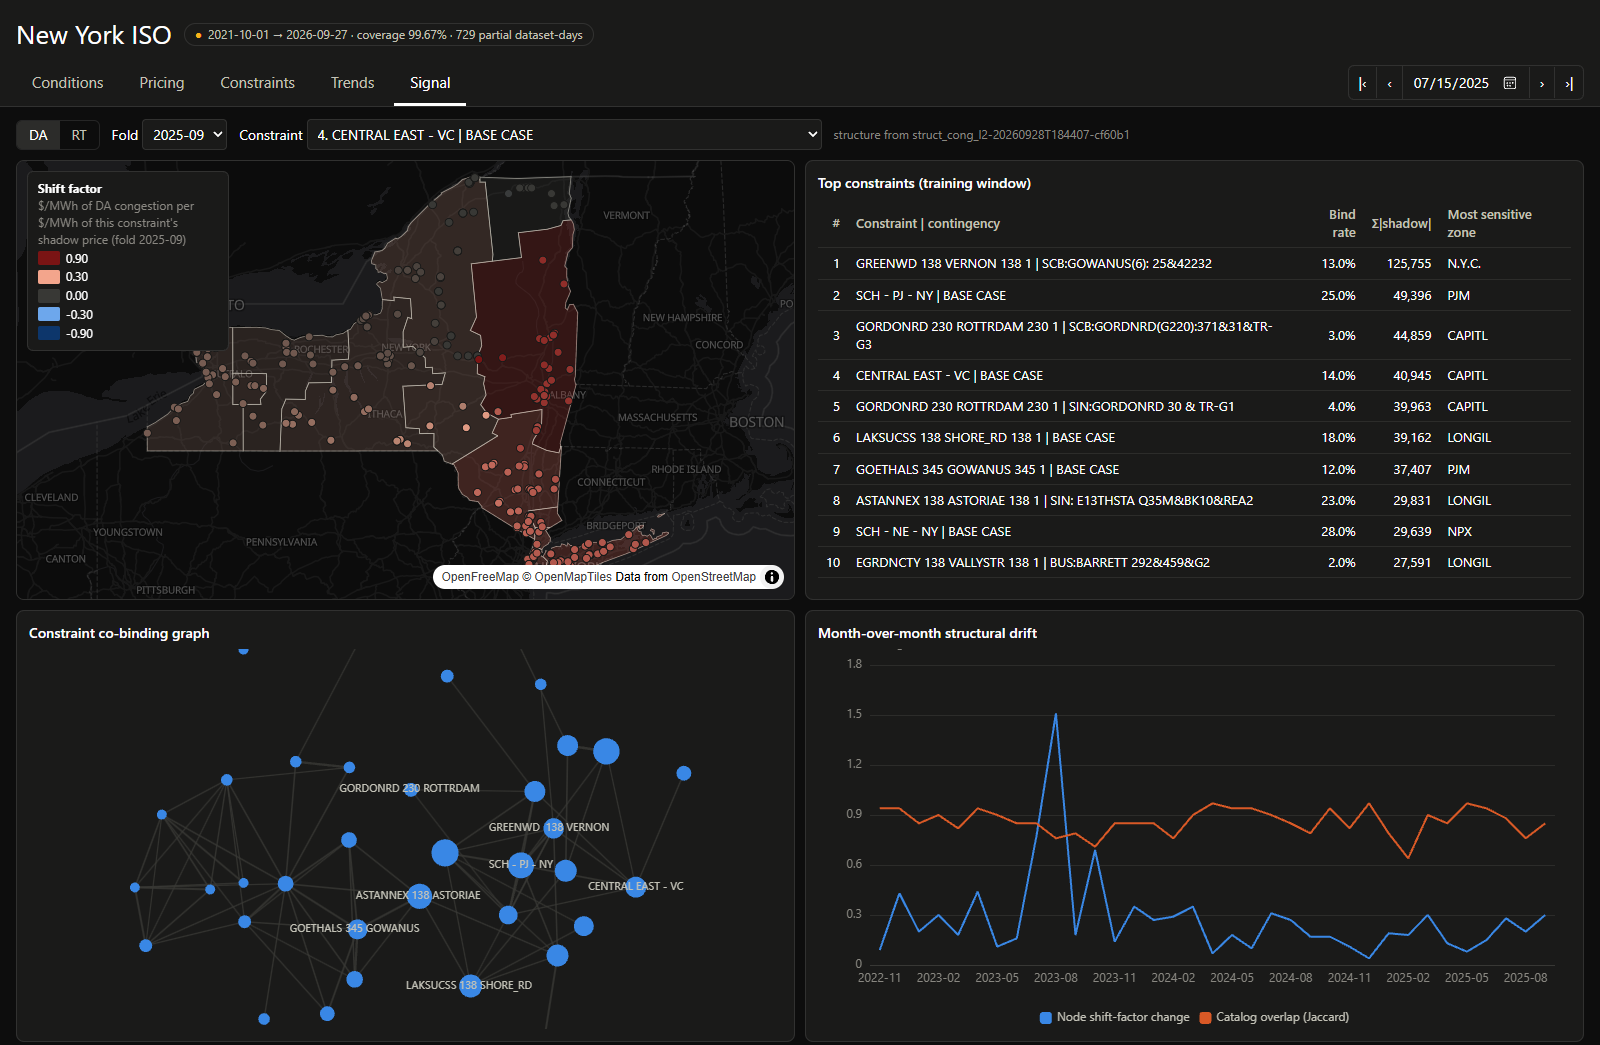
nyiso-grid dashboard: a map of New York shaded by shift factor for the Central East constraint, a table of the top ten binding constraints, a constraint co-binding network graph and a month-over-month structural drift chart.
Shift factors for the Central East interface, the ten constraints with the largest shadow prices, which constraints bind together, and how much that structure drifts month to month.nyiso-grid dashboard

Graphic · A2

The Grid, Mapped

Congestion is why a megawatt-hour in Manhattan can cost several times what it does upstate. The structural model learns which transmission constraints bind, how strongly each one moves prices at each node, and which constraints tend to bind together.

Because the grid itself changes, the model also tracks how much that structure drifts from one month to the next, so stale assumptions show up before they become bad forecasts.

Markets & Trading B1

Infrastructure

A Matching Engine in C, Exact to the Last Share

Replays full LOBSTER days for AAPL and MSFT with zero mismatched snapshots, at 50 ns per message (p50) and no allocation on the hot path. Python can drive it too.

C · Python

Commodities

Neural Nets Lose to Yesterday's Oil Price

An LSTM and an echo state network forecast WTI one step ahead, and naive persistence beats both. So do ridge return models, on two pre-registered holdouts.

Python · TensorFlow

Space reserved for the next project
Benchmark Scorecard · B2
ProjectModelBenchmarkResultNote
monte-carlo-options-multilangMC with antithetic variatesBlack-Scholes▲ MatchedAll three languages within 1.3 SE
options-pricingCRR tree, Crank-NicolsonBlack-Scholes▲ MatchedThree methods cross-validated
term-structure-modelingFour short-rate modelsClosed-form bond prices▲ MatchedVasicek, CIR, HW, BK
lob-engine-cC matching engine replayLOBSTER order book snapshots▲ Matched0 of 1.07M rows mismatched, AAPL and MSFT
game-theory-equilibriaEquilibrium solversGibbons' examples▲ MatchedTextbook answers reproduced
oil-price-predictionLSTM, echo state networkNaive persistence▼ LostPersistence also beats ridge return models on two holdouts
imc-prosperity-market-makingRe-tuned MM (Ash)Fixed-value MM▲ BeatUnseen days, both fill models
imc-prosperity-market-makingTrend-aware MM (Pepper)Hold to the 80-unit limit▼ LostHolding the limit is the ceiling
market-microstructureDouble DQN market makerFixed spread● TiedBeats Avellaneda-Stoikov on held-out seeds
nyiso-gridStructural TCC pricerSame-season persistence▼ No edgeWalk-forward over past auctions
cfb-modeling33 betting hypothesesClosing line▼ No edgeAfter fees, protocols written first
regime-traderHMM regime strategyBuy-and-hold SPY▼ BehindDemo walk-forward Sharpe −0.96 vs 1.08

Results as reported in each repository's README. ▲ model met or beat its benchmark · ● tie · ▼ benchmark won.

Pricing & Models C1

Simulation

Monte Carlo in Three Languages

Animation of thirty simulated risk-neutral GBM price paths starting at 100 and fanning out between about 60 and 170 over one year.
Thirty risk-neutral GBM paths, S₀ = 100, r = 3%, σ = 20%.monte-carlo-options-multilang

Risk-neutral GBM with antithetic variates in C++, Python and R, each within 1.3 SE of Black-Scholes.

C++ · Python · R

Quantum

QAOA Picks a Portfolio

Cardinality-constrained selection, benchmarked against the exact optimum and a greedy classical solver.

Python · Qiskit

Econometrics

What a Used Car Is Worth

VIF-based backward elimination and OLS, validated on synthetic data with known coefficients.

Python

Space reserved for the next project

Tools & Other D1

Fundamentals

Working Through K&R

C99 solutions with unit and golden I/O tests, CI on gcc, clang and ASan/UBSan.

C

Running

Running Form From a Phone Video

MediaPipe pose landmarks turned into cadence, ground contact time and oscillation. Cadence matches a hand count within 0.5 steps per minute on the clip it was tuned on; a held-out clip is still needed.

Python

Games

The Americas, 1836

A turn-based grand strategy game. You play on a map, and the simulation plays on graphs.

Python

Coming Up

  • nyiso-grid: a year of forward DART paper trading
  • cfb-modeling: forward-logged 2026 Kalshi ladders and wind forecasts
  • pose-estimation: a held-out running clip

Careers & Education E1

PositionOrganizationDetail
MS, Computational FinanceCarnegie Mellon UniversityCurrent
Competitor, 2026IMC ProsperityMarket-making bots; see repo
UndergraduateTexas Tech UniversityEconomics, finance and mathematics coursework

Research & Writing E2

Book Chapters

Four Chapters on Sentiment Analysis From Text

Contributed four textbook chapters on sentiment analysis using text data.

About the Author E3

CV Portrait of Caleb Vinson
Caleb Vinson

Profile

Beat the Benchmark, or Say So

Howdy, and thanks for reading. I'm a Master's student in Computational Finance at Carnegie Mellon University, by way of Texas. My work is in algorithmic and systematic trading, derivatives pricing, and forecasting in commodity and equity markets. Most of it is statistical modeling and simulation in Python, R and C/C++.

Every project in this paper is measured against something: a closed form, an exact optimum, a textbook answer, or a naive baseline. When the baseline wins, the headline says so.

EducationMS Computational Finance, Carnegie Mellon University
Undergraduate, Texas Tech University
FocusSystematic trading, derivatives pricing, power markets, market microstructure
LanguagesPython, R, C/C++, SQL, VBA
Contactcalebjvinson848@gmail.com · GitHub

Skills & Coursework

LanguagesPython, R, C, C++, SQL, VBA
LibrariesNumPy, pandas, SciPy, statsmodels, LightGBM, PyTorch, TensorFlow, Qiskit
DataDuckDB, Nasdaq ITCH, NYISO, CRSP/WRDS, IBKR API

Corrections & Amplifications

An LSTM forecasting WTI crude did not beat naive persistence. Neither did the echo state network. (oil-price-prediction)

The Monte Carlo README said the original drift error was 55 standard errors. At the original 10,000 paths it is 6 to 9. (monte-carlo-options-multilang)

The original IMC buy-and-hold baseline bought only 9 units, not the 80-unit limit, and the backtester let quotes fill against trades the trader had just seen. Both are fixed; on the trending product, holding the limit still wins. (imc-prosperity-market-making)

The regime trader's walk-forward on demo data trails buy-and-hold SPY. It does not yet pass its own backtest gates. (regime-trader)